|
|
Elliott Wave
Theory
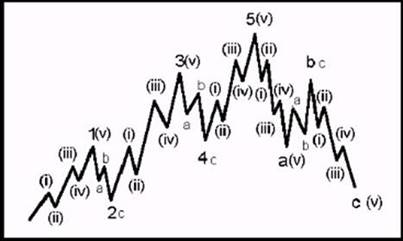
An important feature of Elliott Wave is that they
are fractal in nature. 'Fractal' means market structure are
built from similar patterns on a larger or smaller scales. Therefore, we can
count the wave on a long-term yearly market chart as well as short-term
hourly market chart.
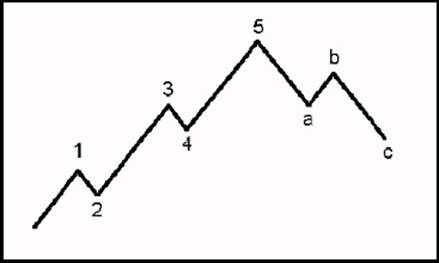
Based on the market pattern, we can identify ' where
we are' in term of wave count. Nevertheless, as the market pattern is
relatively simplistic, there are several rules for valid counts: 1.
Wave 2 should not break below the beginning of Wave
1; 2.
Wave 3 should not be the shortest wave among Wave 1,
3 and 5; 3.
Wave 4 should not overlap with Wave 1, except for
wave 1, 5, a or c of a higher degree. 4.
Rule of Alternation: Wave 2 and 4 should unfold in
two different wave forms.
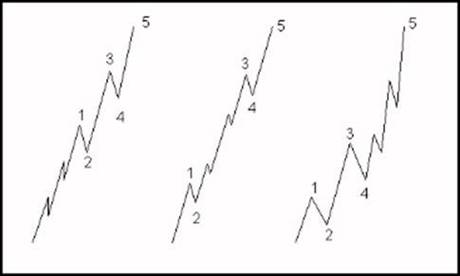
There are three major types of wave form in Impulse
Wave:
Among Wave 1, 3 and
5, only one should unfolded into extended wave. 'Extension' means the wave is
elongated in nature and sub-waves are conspicuous in relation to waves of
higher degree.
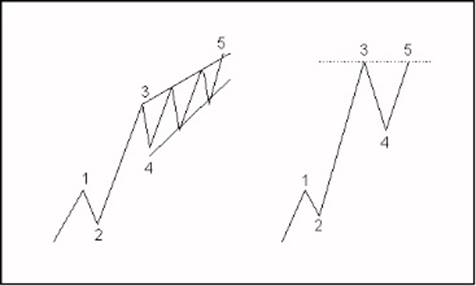
Sometimes, the
momentum at Wave 5 is so weak that the 2nd and 4th sub-waves overlap with
each other and evolved into diagonal triangle.
In some other
circumstances, the Wave 5 is so weak than it even cannot surpass the top of
the wave 3, causing a double top at the end of the trend.
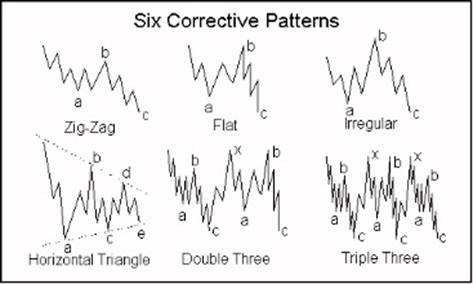
1.
Zig-Zag
:
abc pattern composed of 5-3-5 sub-wave structure. 2.
Flat : abc
pattern composed of 3-3-5 sub-wave structure, with b equals a. 3.
Irregular : abc
pattern composed of 3-3-5 sub-wave structure, with b longer than a. 4.
Horizontal Triangle :
5-wave triangular pattern composed of 3-3-3-3-3 sub-wave structure. 5.
Double Three : abcxabc pattern composed of any two from above, linked by
x wave. 6.
Triple Three : abcxabcxabc pattern composed of any three from above,
linked by two x waves.
�P
Long Term Elliott Wave
Analysis on Dow Jones Industrial Average
|
|
|||||
|
|